For years, a number of politicians and media types have said that Canada’s traditional level of annual immigration has averaged at 1% of our total population. They argue that recent levels of immigration are not really very high, or that 1% is a reasonable policy for immigration.
In the 1993 election, the Liberals, PCs, and NDP were all promising to increase immigration to 1% of population, though no Liberal or Conservative government actually got near that level until after the Covid pandemic.
Even now in 2025, Mark Carney is proposing a 1.0% permanent resident cap after 2027. This might mean an increase, since the 2025 “target” is 395,000 and is set to decrease to 365,000 in 2027 under the current plan. The 1.0% number could mean 420,000 immigrants in 2028, or more.
The 1% number comes from around 1990, when Prime Minister Brian Mulroney made major reforms to the immigration system which gave us high, constant immigration. The 1% immigration number was based on data from 1900 to around 1989 which showed that immigration averaged about about 1% of Canada’s population. A number of economic studies done during the Mulroney years cited the 1% average – but that was over 30 years ago.
To explore this, and to show the immigration numbers and statistics appropriate to 2025 (or at least until Justin Trudeau started to follow the Century Initiative’s lobbying to increase immigration to 500,000 a year after he won power in 2015), I did some digging into the numbers.
I took Canada’s population estimates and immigration numbers from 1900 to 2014, and plugged them into Excel to show the reality of the 1% figure, and how it is obsolete or is being misused since it is 35 years out of date. The nine averages in the last column tell the story.
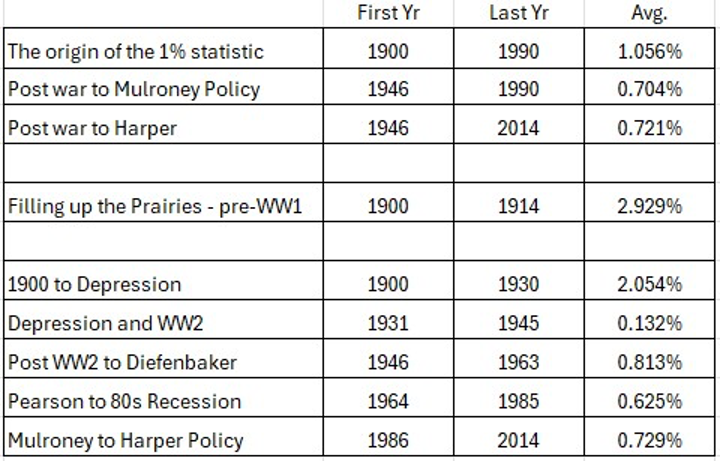
The actual average from WW2 to 1990 was 0.7% – and if you measure to right before Justin Trudeau took office in 2015, it was 0.72%.
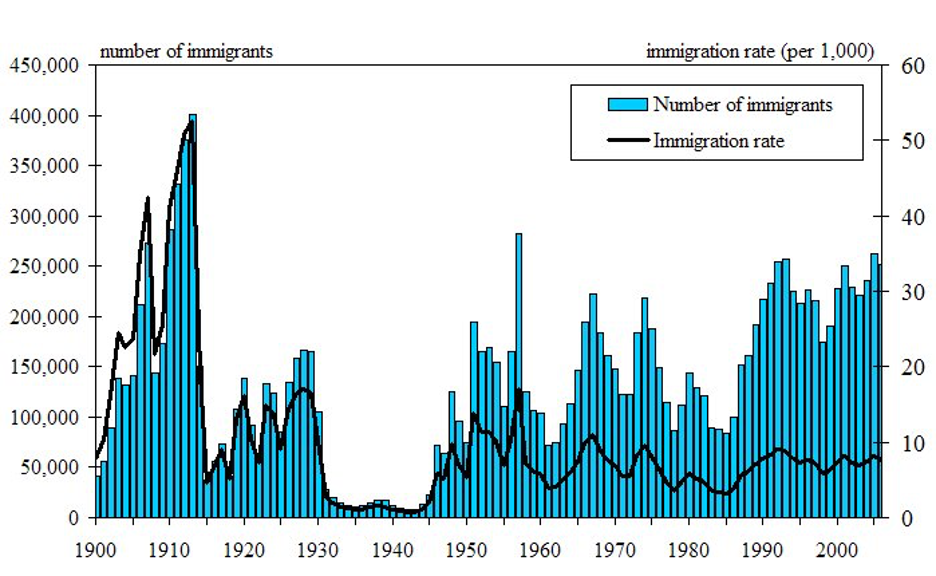
The 1.0% number is skewed by the fact that we had a 3% immigration rate from 1900 to WW1 (even peaking at a remarkable 5% in one year) because we were finally filling up the Prairies with new settlers. From 1900 to the Depression, we still averaged a 2% rate, even with little immigration during WW1. Then, immigration dropped to just 0.13% during the Depression and WW2.
We had about six years with an immigration rate of over 1.0% in the 1950s, as our economy boomed and the world recovered from war. From 1946 to 1963, the immigration rate averaged 0.8%, but there was significant variation between years.
Under Lester B. Pearson and Pierre Elliot Trudeau, the Canadian economy did well, and Canada became more multicultural, but (and this is extremely important) their immigration policy was moderate. The rate was 0.625% from 1964 to the end of the recession in 1985. Immigration ran at under 90,000 from 1983-85.

Mulroney ended the “tap on, tap off” policy, and pleased Bay Street with a new policy of constant high immigration which was around 0.70% to 0.75% or less most years. As a result of this major policy change, from 1986 to 2014 Canada’s immigration rate was around 0.729%.
Remember though, even in Harper’s last years, housing affordability was already problem, and there were things like 0% down mortgages and 40-year amortizations.
All told, there were only seven years between 1946 and 2020 when immigration was over 1.0%, the last one being 1967.
To sum up all of these statistics, the idea that Canada can sustain a 1% immigration rate is totally contrary to our history since WW1, and particularly since WW2.
Trudeau and Pearson were happy with an immigration rate well under 1.0%, and under 0.4% during the 1980s recession (and this was also with minimal numbers of foreign students and temporary workers).
Of course, it might well be that, Canada (or any other country for that matter) can sustain a high immigration rate of 1% or more for short terms, like Canada experienced in the 1950s. However, the longer that high immigration persists, the more likely it is that the economy or society will face severe strains.
Another way of looking at the long-term level of immigration is to look at the percent of the population that is foreign born. The extreme levels of immigration to Canada since 1990 become even clearer when we look at a comparison of the foreign born percentage in Canada and the US.
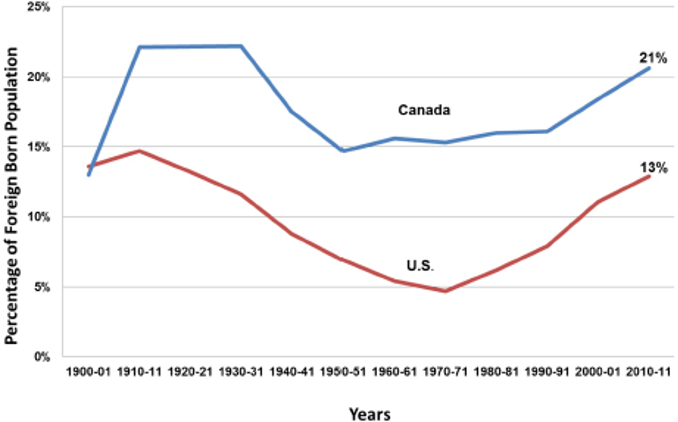
The graph above only goes up to 2011. Canada was at 23% foreign-born in the 2021 Census, which was just when the number of temporary foreign workers and foreign students was spiking in Canada.
Meanwhile, in the last decade, the US has experienced high levels of people crossing their Southern border illegally, or to claim refugee status. The 2021 or later estimates do not really reflect policies of legal immigration and may be far from accurate, since the rate of illegal border crossings is estimated, and people leaving the country are not easy to track.
Canada has at least three million temporary residents, and nobody can accurately estimate if Ottawa’s targets for temporary resident departures are accurate, as most have overstayed visas or simply not left even if their refugee claim was denied. Another trend has been that many people have been given permanent status, but emigrate before getting citizenship.
The just released Liberal Party platform states that the Liberal plan is “capping the total number of temporary workers and international students to less than 5% of Canada’s population by the end of 2027, from a past high of 7.3%”. It also pledges to “stabilize permanent resident admissions at less than 1% of Canada’s population annually beyond 2027 with a focus on attracting top global talent that will drive economic growth and prosperity”.
Sure enough, there is that 1.0% number again! In this case, at least it says “less than”. How much less is very important. There is a need for a major review of Canada’s immigration policy that is not based on skewed statistics, and that is based on our “absorptive capacity” in terms of housing, healthcare, and the economy.
In contrast, Conservative Leader Pierre Poilievre has been talking about a return to the Harper era numbers of 250,000 annual permanent residents – or possibly a lower rate, depending on housing and other factors. This would mean a level under 0.60%.
It is relevant to look at the growth rates of various G7 countries. In 2018 – before the pandemic and looking at all population growth – Canada grew by 1.4%. In contrast, the US grew at 0.7%, the UK at 0.6%, and both Germany and France at 0.3%. Italy and Japan both lost population.
The UK had housing issues even with 0.6% growth. Given that the massive level of permanent and non-permanent immigration to Canada has of late far exceeded immigration to the UK, it could take years of little or no immigration for Canada to properly absorb the high number of newcomers we have received since 2015. Even returning our rate to 0.6% might not be enough of a cut. Housing has been an issue in every G7 country with positive population growth, both before and after the pandemic.
The 1% immigration rate cited by politicians and media types includes the pre-WW1 period when it was triple 1.0%, and the period up to 1930 when it was double 1%. Even with the depression and war years, it still skews our historic immigration rate well above the average immigration rate Canada has maintained since WW2.
So, the next time someone says that a 1% immigration rate is reasonable or is an average from our past, dispute this.
All content on this website is copyrighted, and cannot be republished or reproduced without permission.
Share this article!

The truth does not fear investigation.
You can help support Dominion Review!
Dominion Review is entirely funded by readers. I am proud to publish hard-hitting columns and in-depth journalism with no paywall, no government grants, and no deference to political correctness and prevailing orthodoxies. If you appreciate this publication and want to help it grow and provide novel and dissenting perspectives to more Canadians, consider subscribing on Patreon for $5/month.
- Riley Donovan, editor